Opening hours: 10 am to 6 pm
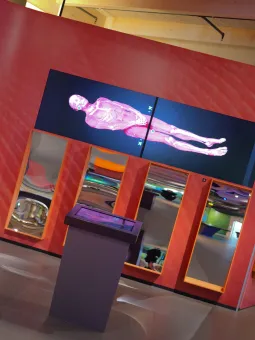
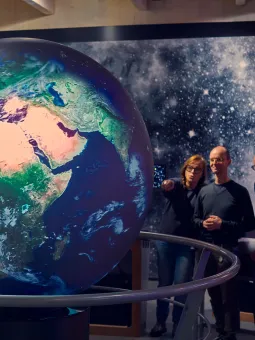
UNIQUE VISUALIZATION LAB SHOWS THE COMPLEXITY OF THE WORLD.
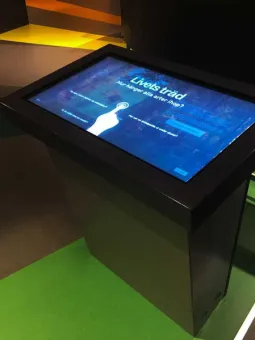
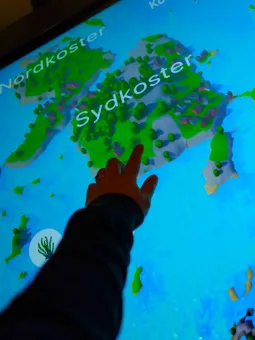
How is drinking a cup of coffee affected the earth? Where in Gothenburg is the most energy consumed? What happens to the lions of the savannah if the average temperature increases? In the visualization lab, you make your own expeditions in real research data, like a digital explorer in search of questions and answers about, for example, space, climate and urban development.
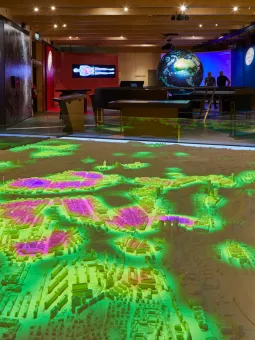

Find your way to a sustainable world.
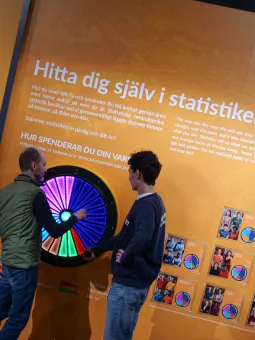
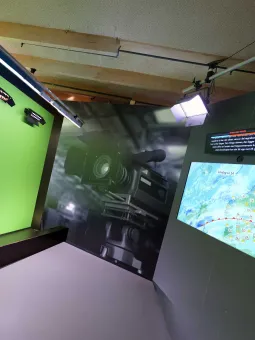
Vislab connects the local with the global. Here are examples of how the world is connected and affected by different factors. When you understand the data and combine the insights in the lab with other experiences at Universeum, your knowledge of sustainable development will be deepened and strengthened.
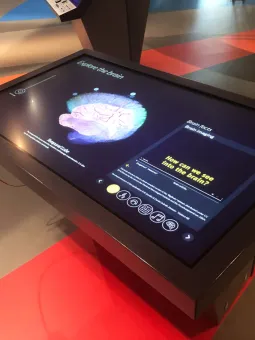
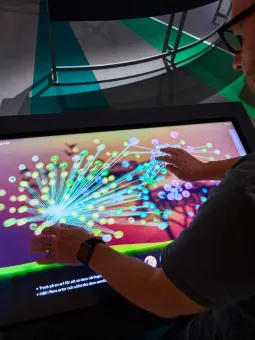
Experiences in Vislab
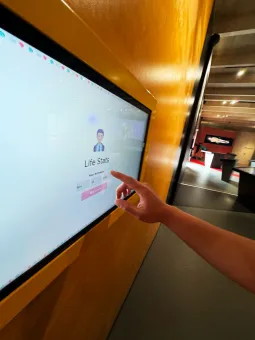
Experiment with visualized data to try to understand the world. Here are some of the different stands you can experience in the exhibition.